So far the sneak peeks for CaseDetective 1.1 haven’t been all that enthralling, even I am able to admit that the features I’ve shown aren’t that big a deal to most users of CaseDetective and FogBugz.
This one may turn a few heads though, CaseDetective for FogBugz 1.1 will include the ability to view some “potted” graphs, just like this one:
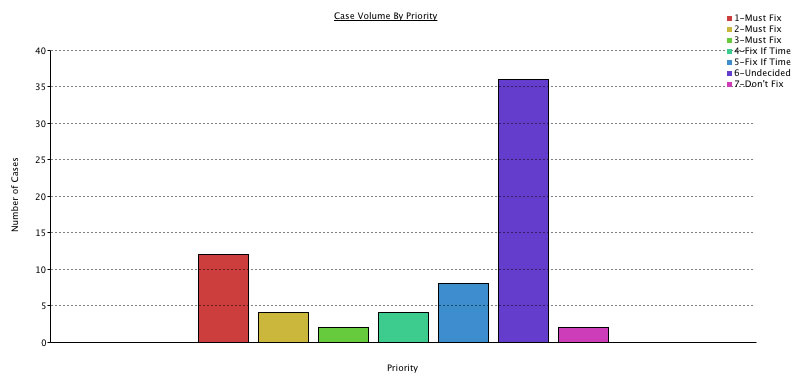
The above graph was grabbed from the new “Overview” pane, which includes the previously sneak peeked Last 50 Events list. To be able to include graphs of statistics from FogBugz in your reports, all you have to do is select an appropriate filter and pick the type of graph you want, then simply copy and paste the graph into your report. It’s as simple as 1-2-3!
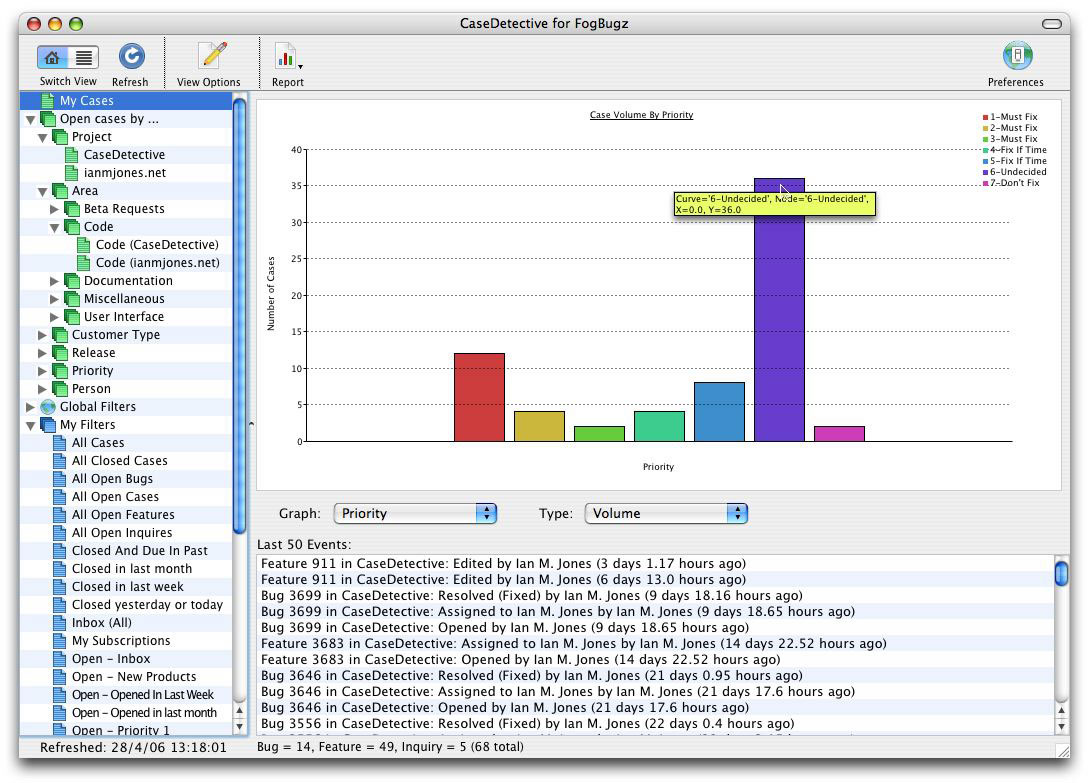
And as you can see from the above screenshot (click it for a better view), when you hover your cursor over a “node” you get a little yellow pop-up with a bit of info about it, such as the number of cases (Y value).
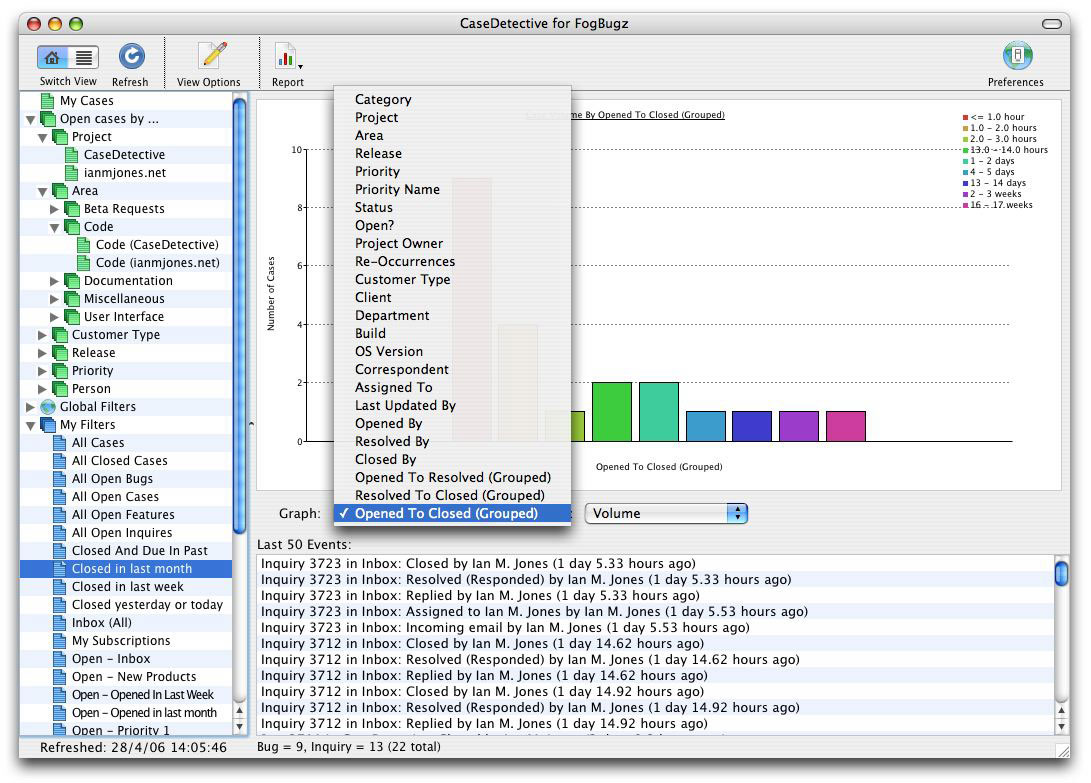
For some people this could be a real time saver, as it’s a very quick way of finding out how many of your FogBugz Cases are in a particular Priority, Status, Release and so on, there are quite a few fields you can graph:
And of course, you need to be able to see when it was that you had that sudden spike in feature requests opened, resolved, closed or last updated:
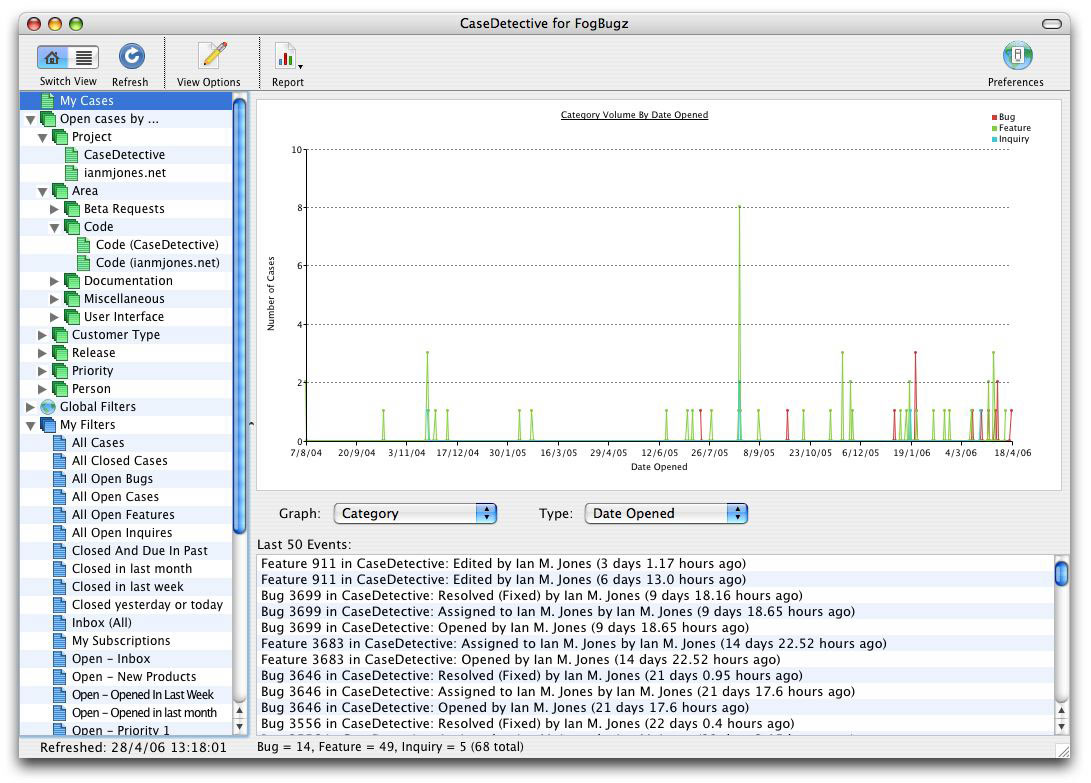
Being able to quickly see patterns in your FogBugz data through graphs and charts in CaseDetective for FogBugz should hopefully help a lot people get through their day that little bit quicker when it comes to getting those reports out.
